Production Performance Brief
Water Bottling Line OEE: Measure the Loss Before the Upgrade
Separate lost production time, reduced speed and first-pass rejects so a better percentage does not hide unchanged bottled-water output.
Direct answer
How do you calculate OEE for a complete water bottling line?
Review point 01
Define the line, not just the fastest machine
Mark the included machines, first-pass completion point, counting units and reference bottle/pack. Use an ideal rate for this connected process, not the filler nameplate by default and not a budget rate already reduced by expected losses. Keep the rate and its evidence with the record. When products have different ideal rates, calculate each run separately before combining productive-time totals.
- Convert complete packs to bottle equivalents using the approved pack size.
- Reconcile opening and closing work-in-process when count points are separated.
- A quality hold is not a confirmed good count; report the result as provisional until disposition is known. Reworked units do not become first-pass good units.
Review point 02
Keep planned production time and stop time separate
Record when production was intended to run. Time with no production scheduled is outside the OEE denominator, but a planned changeover within the production schedule is still a stop loss. Do not remove it merely because it was expected. State any site-specific sanitation treatment openly and retain the full shift-output record for comparisons.
- Availability = run time / planned production time.
- Performance = total first-pass count / (ideal bottles per minute × run minutes).
- Quality = first-pass good count / total first-pass count.
- Set a fixed short-stop classification rule. Events retained inside run time appear in Performance; do not subtract their time again from Availability.
Review point 03
Worked example: where 82.32% comes from
Illustrative single-SKU record: a 480-minute shift has 30 minutes with no production scheduled, leaving 450 planned production minutes. A 20-minute changeover and a 10-minute breakdown leave 420 run minutes. At an ideal 100 bottles/minute, the line completes 37,800 first-pass bottles; 756 fail first-pass checks and 37,044 are good. Availability is 420/450 = 93.33%, Performance is 37,800/42,000 = 90%, and Quality is 37,044/37,800 = 98%. OEE is 82.32%, also 37,044/45,000. Use unrounded values for the calculation.
- The table below reconciles the 450 minutes without charging the same loss twice.
- The rate and counts are invented solely to explain the method, not a machine rating, customer test or promised result.
- If a factor exceeds 100%, investigate the rate, units, counters and time boundary; do not silently cap it. Zero denominators mean the factor is not calculable.
Review point 04
Use the loss evidence to choose the next investment
Low Availability calls for validated stop and recovery evidence. Low Performance needs short-stop and running-speed evidence. Low Quality requires the actual defect and first-pass disposition records. A faster filler is not justified by the combined score alone: check whether supply, packing, transfers or operating conditions create the loss.
- Compare the same SKU, included machines, ideal rate and counting rules before and after a change.
- Keep actual first-pass good bottles, shift duration and quality results beside OEE; a shorter denominator can improve the score without producing more bottles.
- Send a non-confidential shift summary, current line configuration and the required output for a performance-led upgrade review.
| Time component | Calculation | Minutes | What it tells the buyer |
|---|---|---|---|
| Stop loss | 450 − 420 | 30 | Includes the scheduled changeover and breakdown. |
| Speed and short-stop loss | 420 − 37,800/100 | 42 | A combined performance gap, not a proven root cause. |
| First-pass quality loss | 756/100 | 7.56 | Equivalent ideal time for first-pass rejects. |
| Fully productive equivalent | 37,044/100 | 370.44 | 82.32% of the 450-minute production window. |
| Reconciled total | 30 + 42 + 7.56 + 370.44 | 450 | No additional micro-stop deduction is applied. |
Catalog equipment evidence
See the machines behind this production-line question.
These Allot Tech catalog references connect the technical explanation to physical equipment. Each caption identifies the capacity, interface or acceptance evidence to confirm.

Water bottling production process flow
Separate water preparation, bottle supply, filling, decoration and packing, then compare every node on one output basis.
Review this interface basis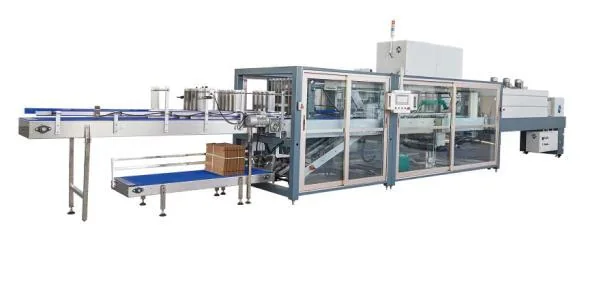
End-of-line packing system
The packer is one connected capacity node; pack pattern, cycle, bottle behavior and discharge flow set the usable rate.
Review this interface basisSource: Allot Tech Beverage Bottling Catalog 2026. Images are representative equipment references; final models and configurations remain project-specific.
Questions before specification
Frequently asked questions
Answers are planning guidance. Project requirements and performance remain subject to confirmed data and agreements.
Is 85% OEE a required acceptance target?
No universal percentage establishes whether your line meets its purchase requirement. Agree the actual output, formats, quality conditions and test window. Use OEE to locate losses, not as a substitute for that agreement.
Can I average the OEE percentages of all machines?
No. Their count boundaries, ideal rates, buffers and overlapping stops differ. Calculate the connected process from its own time and first-pass output records; retain machine metrics for diagnosis.
Should a planned changeover disappear from OEE?
No. A changeover inside scheduled production consumes production time and belongs in the stop record. Distinguish it from time when no production was scheduled, and do not change the rule to improve a comparison.
Does a quarantined bottle count as good output?
Not while its disposition is unresolved. Keep it distinct and label the calculation provisional. Later rework must not be reclassified as first-pass good output.
Next buyer step