Production Performance Brief
Will Your Bottling Line Buffer Protect the Next Stop?
A buffer has two different reserves: bottles available to feed the next machine and free space available to receive more bottles. Review both from the actual starting level.
Direct answer
How do you calculate usable buffer time on a water bottling line?
Review point 01
Identify the reserve that the interruption consumes
Define the approved bottle, conveyor zone, minimum operating inventory and maximum permitted inventory. Read the actual starting count. An upstream interruption consumes stocked bottles; a downstream interruption consumes free space. Sensor thresholds, transfers, bottle stability and access can limit usable inventory before a conveyor looks full or empty.
- Record current occupancy and both operating limits on the same count basis.
- Verify limits with the actual bottle and approved controls; conveyor length is only a layout input.
Review point 02
Calculate from the starting level, in one unit
Illustrative example, not a machine rating: the zone has a maximum of 900 bottles, a minimum of 100 and starts at 400. At 6,000 bottles/hour, or 100/minute, a fully stopped downstream machine leaves 500 free places: 500 ÷ 100 = 5 minutes. A fully stopped upstream machine leaves 300 usable bottles for consumption: 300 ÷ 100 = 3 minutes. The total operating range is 800 bottles, but it is not an eight-minute reserve in both directions.
- Convert packs to bottles with the actual pack factor before comparing rates.
- For partial slowdowns, use arrivals minus departures for filling, or departures minus arrivals for depletion.
Review point 03
Check recovery before the next interruption
After 500 extra bottles accumulate, a downstream recovery rate of 150 bottles/minute against an incoming 100 removes only 50/minute. Returning to the original level therefore takes 500 ÷ 50 = 10 minutes. These are constant-rate assumptions. Equal rates do not restore the level during continued production. Restart ramps or recurring stops make recovery longer.
- Measure actual recovery rates on the approved format, not a nominal maximum.
- Record the time until the starting level returns; restarting a machine does not prove recovery.
Review point 04
Use a witnessed sequence to choose the intervention
Review the event that starts the loss, the occupancy trend, starved/blocked states and accepted output on one timeline. Qualified personnel should use approved operating procedures for any stop trial. Check bottle condition during accumulation and release. If the next event arrives before recovery, compare control changes, rate margin and the initiating machine problem before selecting additional conveyor.
- Send the zone limits, starting count, event duration and observed rates for review.
- Keep calculated protection separate from measured accepted output; this worksheet does not validate safety or guarantee a gain.
Method background
| Condition | Available quantity | Illustrative result |
|---|---|---|
| Downstream fully stopped | 900 − 400 = 500 bottles | 500 ÷ 100 = 5 min |
| Upstream fully stopped | 400 − 100 = 300 bottles | 300 ÷ 100 = 3 min |
| Recovery after accumulation | 500 extra bottles; 150 − 100 = 50/min | 500 ÷ 50 = 10 min |
Catalog equipment evidence
See the machines behind this production-line question.
These Allot Tech catalog references connect the technical explanation to physical equipment. Each caption identifies the capacity, interface or acceptance evidence to confirm.
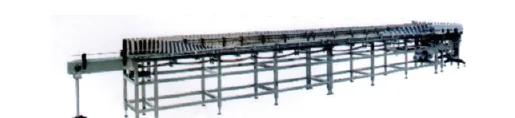
Air conveyor and bottle accumulation
Usable accumulation is a controlled time buffer, not simply conveyor length. Confirm bottle stability and recovery after stops.
Review this interface basis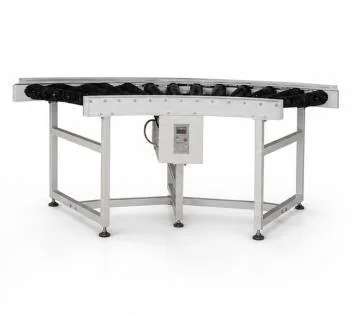
Bottle conveyor transfers
Transfer plates, guides, elevations and speed zones must suit the approved bottle under real wet and dry conditions.
Review this interface basis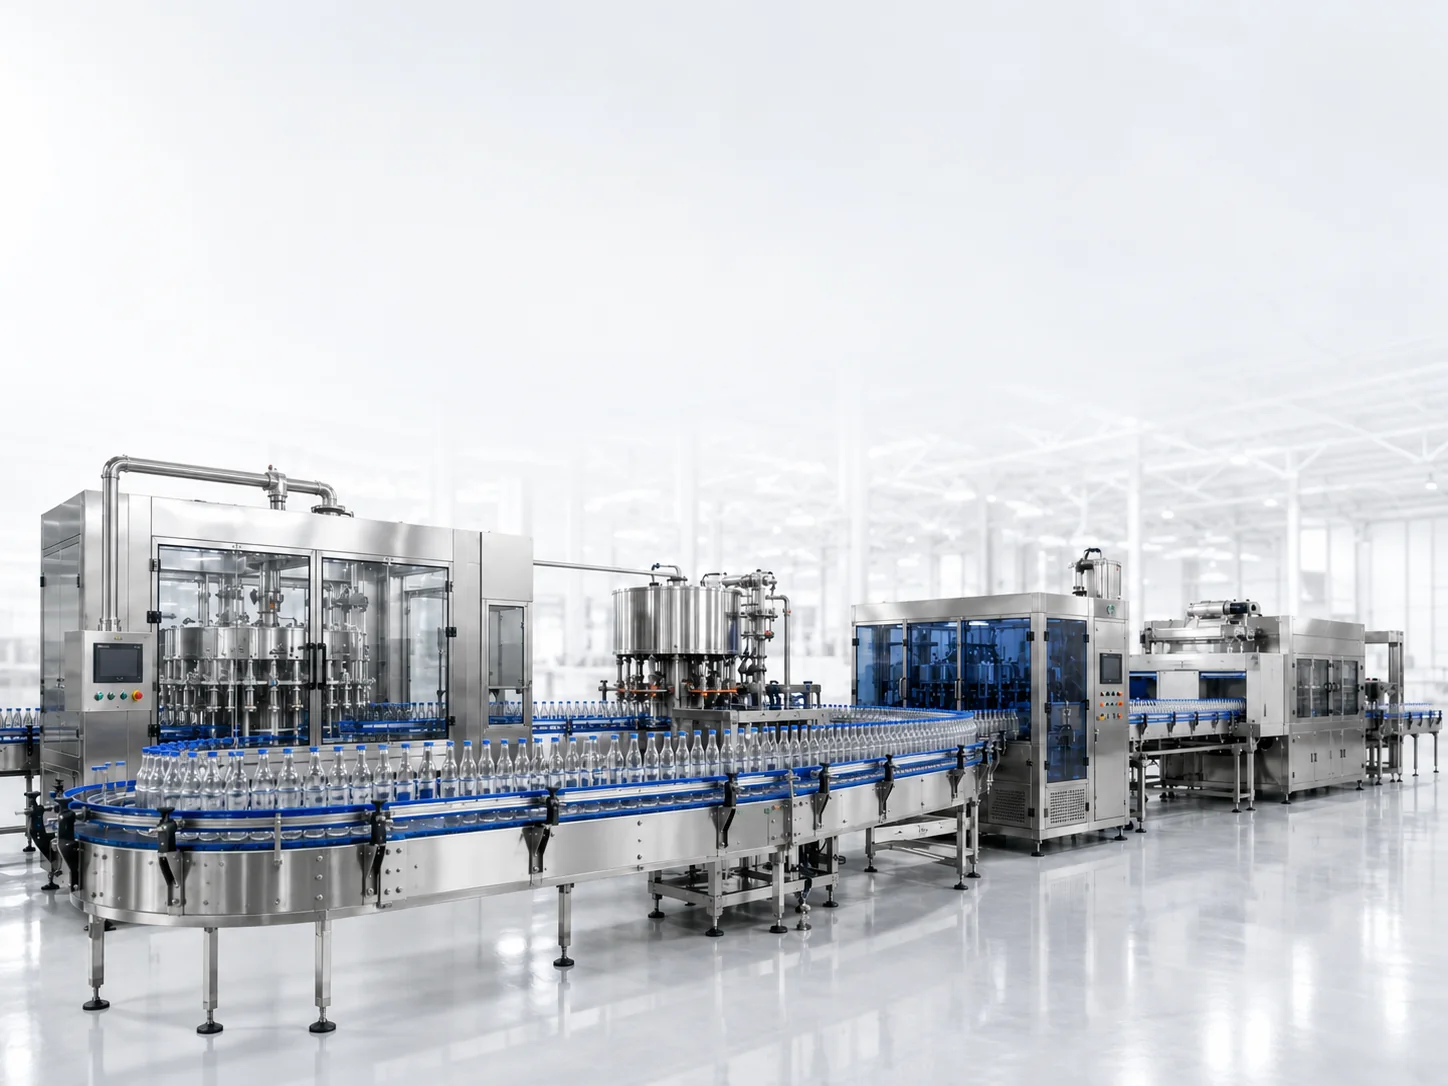
Connected water bottling line
Use the complete-line view to mark machine boundaries, transfer points, utilities, controls and output counting locations.
Review this interface basisSource: Allot Tech Beverage Bottling Catalog 2026. Images are representative equipment references; final models and configurations remain project-specific.
Questions before specification
Frequently asked questions
Answers are planning guidance. Project requirements and performance remain subject to confirmed data and agreements.
Does a longer conveyor always improve output?
Only if the added area provides verified usable capacity and the line can recover. A recurring rate mismatch eventually exhausts any finite buffer.
Can I use the filler rating for every calculation?
Use the observed or agreed arrival and departure rates for this SKU and event. Different count boundaries or gross and accepted units cannot be mixed.
What should accompany a buffer quotation request?
Include the bottle/pack, zone diagram, operating limits, occupancy, stop pattern, connected rates and release behavior. Mark unknown values explicitly.
Next buyer step