Mr Kcal · Allot Tech Project Desk Email sales@allottech.com China / WhatsApp +86 186 6213 1120 USA +1 818 262 0958

Production Performance Brief

Water Bottling Line Capacity and Balance Calculation

Find out whether water treatment, bottle supply, filling, labeling and packing can support the same output before buying a faster machine.

Direct answer

How do you calculate water bottling production-line capacity?

Convert net product-water flow and packing speed into bottles per hour for one bottle and pack format, then compare them with the compatible blower, filler and labeler rates. The lowest value is a screening limit, not a guarantee of accepted production.

Review point 01

Worked example: a 500 ml bottle in a 12-bottle pack

Illustrative arithmetic only, not an Allot Tech equipment rating or customer result. Assume compatible running rates of 3,600 L/h net product water, 7,000 bottles/h from the blower, 6,000 from the filler, 6,500 from the labeler and 8 packs/min from the packer.

  • Water: 3,600 ÷ 0.5 = 7,200 bottles/h; this is product water, not raw-water feed.
  • Packer: 8 × 12 × 60 = 5,760 bottles/h.
  • Screening limit: min(7,200, 7,000, 6,000, 6,500, 5,760) = 5,760 bottles/h.
  • The packer is the first capacity question. Increasing filler nameplate speed alone does not remove that limit.
Review point 02

Turn daily demand into the rate you actually need

If a hypothetical order needs 40,000 accepted bottles in an 8-hour net running window, the requirement is 5,000 accepted bottles/h. At 98% yield, this implies about 5,102 gross bottles/h during that same running window. If the 8 hours include downtime, subtract it or explicitly model availability first; do not call scheduled time net run time.

  • Declare whether demand is in bottles, packs or cartons.
  • Use the actual SKU changeover and sanitation schedule.
  • Compare the required rate with measured line-end output, not only nominal machine capacities.

Review point 03

Do not subtract the same losses twice

A nameplate rate, an observed running rate and an accepted shift-average rate have different loss boundaries. Apply an availability, performance or quality factor only for losses not already included in the supplied rate. Multiplying a measured good-output average by OEE again understates production.

  • Ask whether a rate includes stops and rejected units.
  • Keep the time window and counting point with every number.
  • Use gross-compatible rates for a loss model, or directly compare accepted measured rates on the same window.

Review point 04

What to confirm before approving an upgrade

For the example above, check the packer cycle on the real pack, film or carton, including material replenishment and recovery. Compare that evidence with the current good-pack count. A packing-speed change may simply expose the filler as the next constraint.

  • Reference bottle drawing and bottles per pack.
  • Timed rates, reject counts and shared timestamps.
  • Buffer occupancy, restart behavior and point-of-use utility conditions.
  • Send the worksheet and your required accepted output to request a line review.

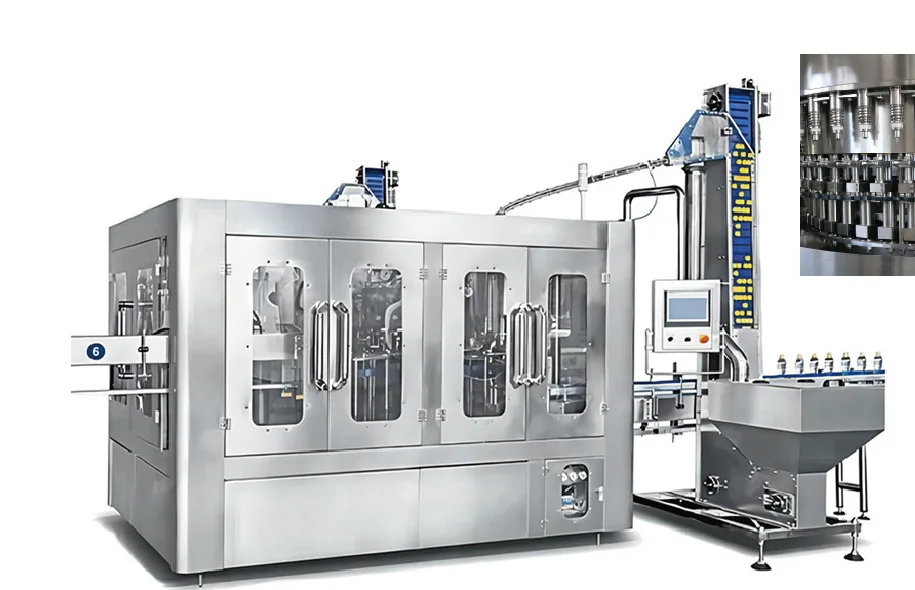
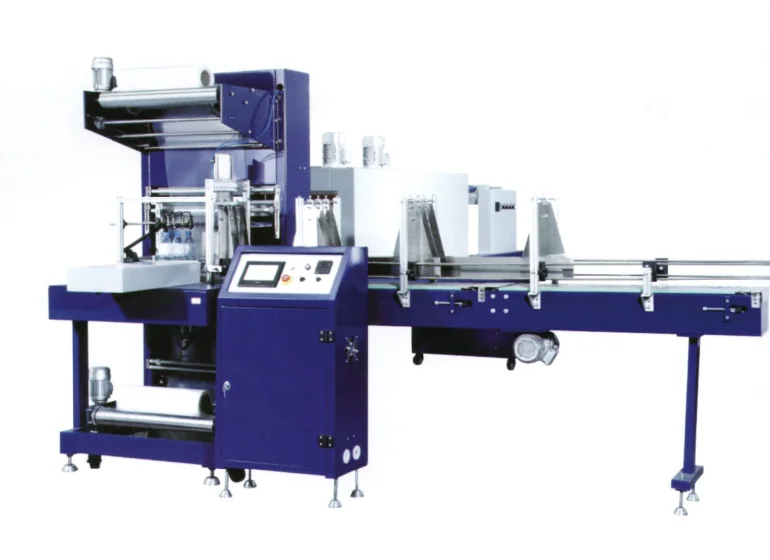
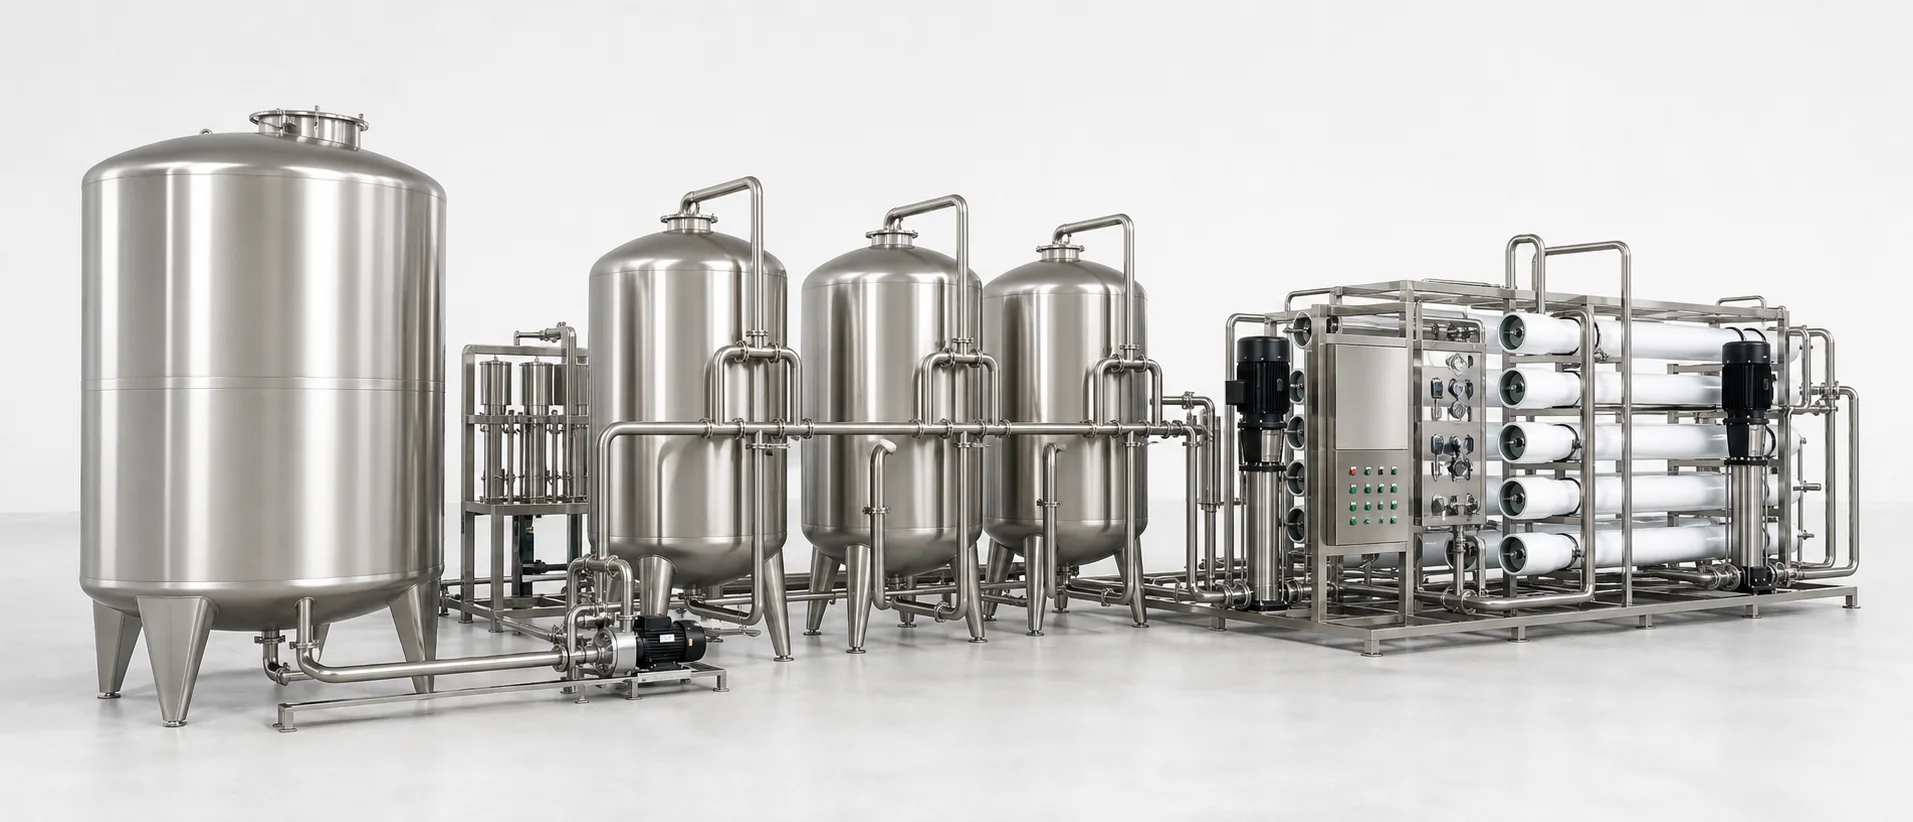
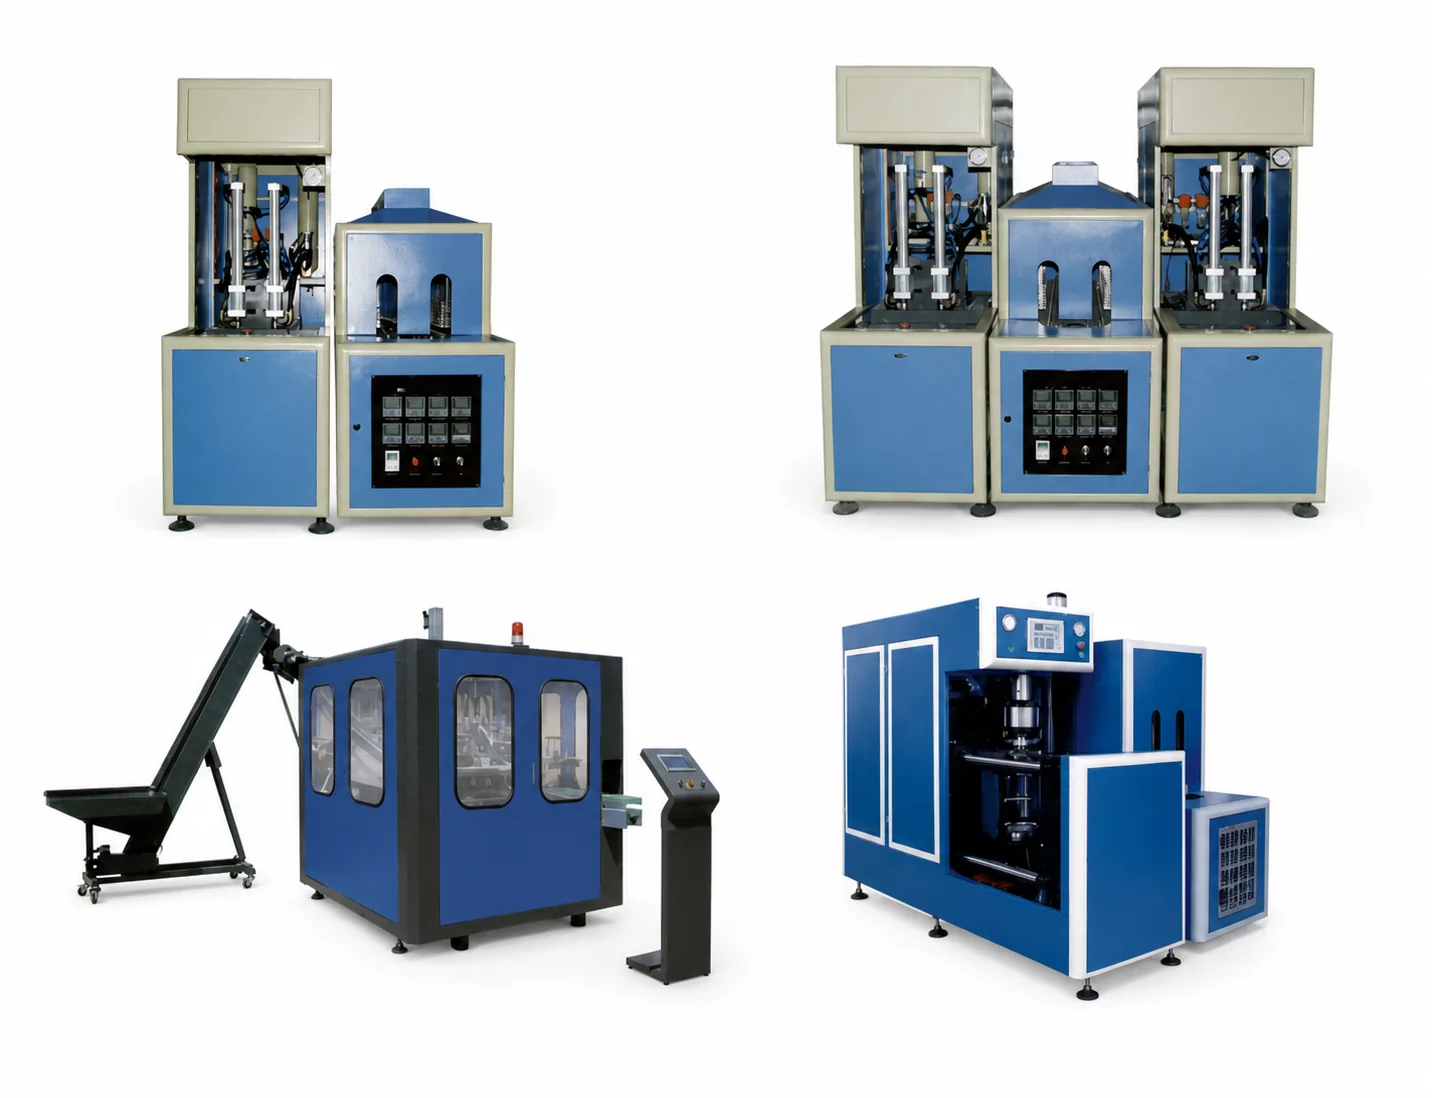
Catalog equipment evidence

See the machines behind this production-line question.

These Allot Tech catalog references connect the technical explanation to physical equipment. Each caption identifies the capacity, interface or acceptance evidence to confirm.

Source: Allot Tech Beverage Bottling Catalog 2026. Images are representative equipment references; final models and configurations remain project-specific.

Line-balance worksheet

Convert every connected capacity to the same BPH basis.

The lowest compatible value is the preliminary technical limit. Normalize capacities first, then apply only losses not already included in each rate. A measured accepted shift-average rate must not be reduced by the same losses again.

Connected inputBPH conversionEvidence to confirm
Product-water supplyNet L/h ÷ bottle volume in litersNet treated-water flow at the filler connection
Bottle supplySustained accepted bottles/hourApproved preform or bottle and representative run
Rinse-fill-cap centerSustained bottles/hour on the reference SKUBottle, closure, product and test duration
LabelingAccepted labeled bottles/hourBottle surface condition, recipe and reject record
Secondary packingPacks/min × bottles/pack × 60Accepted pack cycle and pack pattern

Worked comparison example

For a 500 ml bottle, 6,000 L/h of net product water converts to 12,000 BPH. If the same-basis blower is 11,000 BPH, filler 12,000 BPH, labeler 10,500 BPH and a six-bottle packer sustains 24 packs/min, packing converts to 8,640 BPH and becomes the preliminary technical limit. At deliberately entered factors of 90% availability, 95% performance and 99% quality, the preliminary good rate is about 7,313 BPH. These are example inputs, not a project promise.

Use compatible gross reference capacities for one bottle and pack. Do not enter accepted shift-average rates and deduct their losses again. Leave unknowns blank; percentages are not prefilled.

Hours are the planned production window before the downtime counted in availability. If you already removed that downtime, do not deduct availability again. Zero percent is valid; blank means unknown.

Preliminary planning only; not a specification, guaranteed rate or commercial offer. The latest result stays in this browser tab until you clear it. It is sent to Allot Tech only if you submit an enquiry.

Two-pass capacity method

Calculate the technical constraint first; model saleable output second.

Mixing rated speeds, assumed efficiency and unlike units in one comparison hides the real constraint. Keep the technical rate conversion separate from the operating-loss scenario so a reviewer can challenge either layer without rebuilding the whole calculation.

01

Pass 1 — normalize capacities

Convert net product-water flow, accepted bottle supply, rinse-fill-cap output, labeled bottles and pack cycles to bottles per hour for one reference SKU. The lowest compatible sustained rate is the preliminary technical constraint.

02

Pass 2 — state operating factors

Apply planned production time, availability, performance and quality only when their definitions and evidence are visible. Do not hide a utilization allowance inside a machine rate and then apply it again at line level.

03

Test the interaction

Check whether short stops can be absorbed and whether upstream or downstream equipment has enough speed margin to restore the buffer. Equal headline rates can create a line that never recovers after normal interruptions.

Minimum evidence set

Keep these inputs beside the decision.

  • Same bottle and pack basis for every rate
  • Net rather than installed treatment flow
  • Accepted rather than molded or gross bottle count
  • Packs per minute converted by bottles per accepted pack
  • Explicit operating-time and reject assumptions
  • Recovery margin after an interruption

Questions before specification

Frequently asked questions

Answers are planning guidance. Project requirements and performance remain subject to confirmed data and agreements.

How many bottles per hour is a packer rated at 8 packs/min?

For 12 bottles per pack, 8 × 12 × 60 = 5,760 bottles/h. A 6-bottle pack at the same pack cycle is 2,880 bottles/h; the machine may not sustain the same cycle on both formats.

Does changing from 500 ml to 1 L halve line output?

It halves the water-flow equivalent if net water supply is fixed, but blower, filler and packer speeds may change differently. Recalculate every module on the 1 L SKU.

Should I add a fixed 10% speed margin to every machine?

There is no universal margin. Size recovery capacity from measured stops, usable accumulation, bottle stability and the reference SKU; confirm it in a connected test.

Next buyer step

Calculate My Line Balance

Calculate My Line Balance
WhatsApp ↗